Introduction to multiplication tables
The multiplication table is probably the most widely used tactic for depicting a group operation. Let’s take a look at some of its potential. If you have not yet encountered the multiplication table visualizer, start with these help pages:
- The definition of a multiplication table
- The documentation on the multiplication table interface in Group Explorer
CITE(VGT-4.3 MM-1.5 DE-5.3)
What multiplication tables do well
Coloring the backgrounds of multiplication tables’ cells reveals patterns in the group operation. Let’s illustrate this by contrasting a bad example with a good one.
Bad example
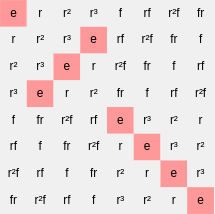
The backgrounds of the cells in this multiplication table are colored based on whether they are in a particular 2-element subgroup. This does not look as helpful in a multiplication table as it does in a cycle graph or Cayley diagram, because each element appears multiple times in a multiplication table.
Good example
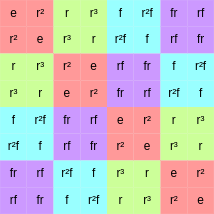
The backgrounds of the cells in this multiplication table are colored based on their membership in the cosets of the subgroup highlighted in red. This shows how the group operation in this example respects the cosets nicely–in fact, by considering each block of like-colored neighbors as one big cell, one can see the multiplication table of the quotient group! The subgroup in question is therefore normal.
Exercise
Consider it an exercise to find a group with a non-normal subgroup and highlight a multiplication table of that group by the cosets of the non-normal subgroup.
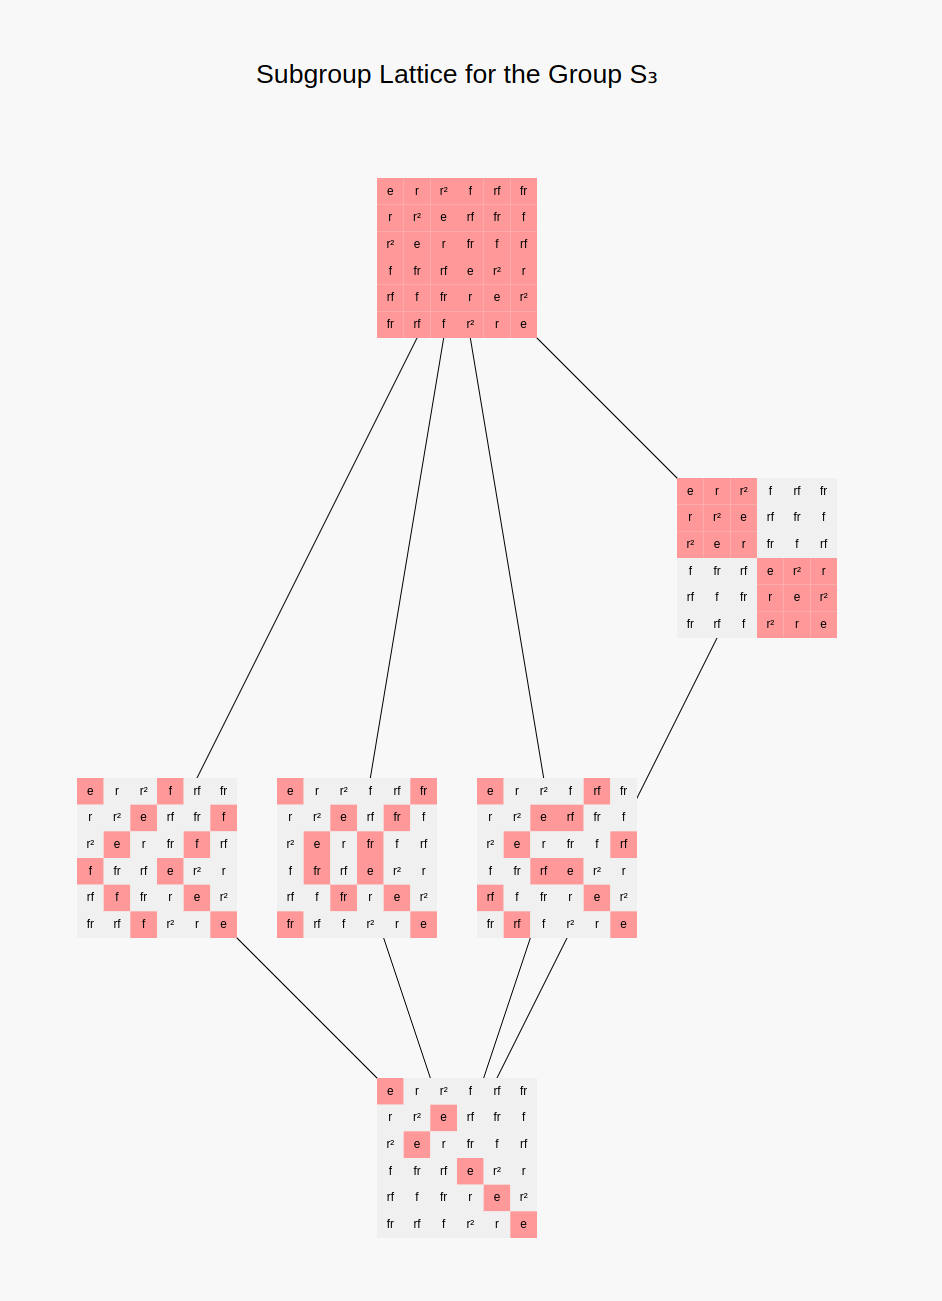
There are some illustrations can be made from just about any kind of visualization, including multiplication tables. For instance, we can use multiplication tables to illustrate a lattice of subgroups or a short exact sequence of groups, or we could use another kind of visualization as well. Both of these advanced uses of multiplication tables tie in homomorphisms, which are visible on sheets.