SemigroupViz
Visualization Tools for Semigroups
Version 1.0.0
Released 2019-03-21
This project is maintained by Nathan Carter
The Semigroup Visualization Package
Purpose
This package adds visualization tools for semigroups. It is built on the JupyterViz package, which means that the visualizations it creates can be used either in Jupyter notebooks or from the GAP REPL.
Supported Visualizations
There are two supported visualization of a semigroup:
Egg-box Diagrams
Let S be a semigroup and make the following definitions, which introduce Green’s Relations, each of which is an equivalence relation on S.
- Let S1 be the corresponding monoid (S plus an identity iff it doesn’t have one).
- Write S1a for the principal left ideal generated by a.
- For a and b in S, write aLb iff S1a=S1b.
- Similarly, aS1 is a principal right ideal and S1aS1 is a principal two-sided ideal.
- And naturally also define aRb for the right ideals and aJb for two-sided ideals.
- Define aHb iff aLb and aRb.
- Define aDb iff the R-class for a and the L-class for b intersect.
Thus Green’s relations are the L, R, J, D, and H. They give us the following situation:
- S is partitioned into D-classes.
- Within each D-class, it is partitioned into both L-classes and R-classes.
- One can think of each L-class as a column and each R-class as a row, forming a grid.
- Each cell in the grid is an H-class, an intersection of an L-class and an R-class.
Hence the name “egg box” (or “egg carton”) which is also a grid of cells.
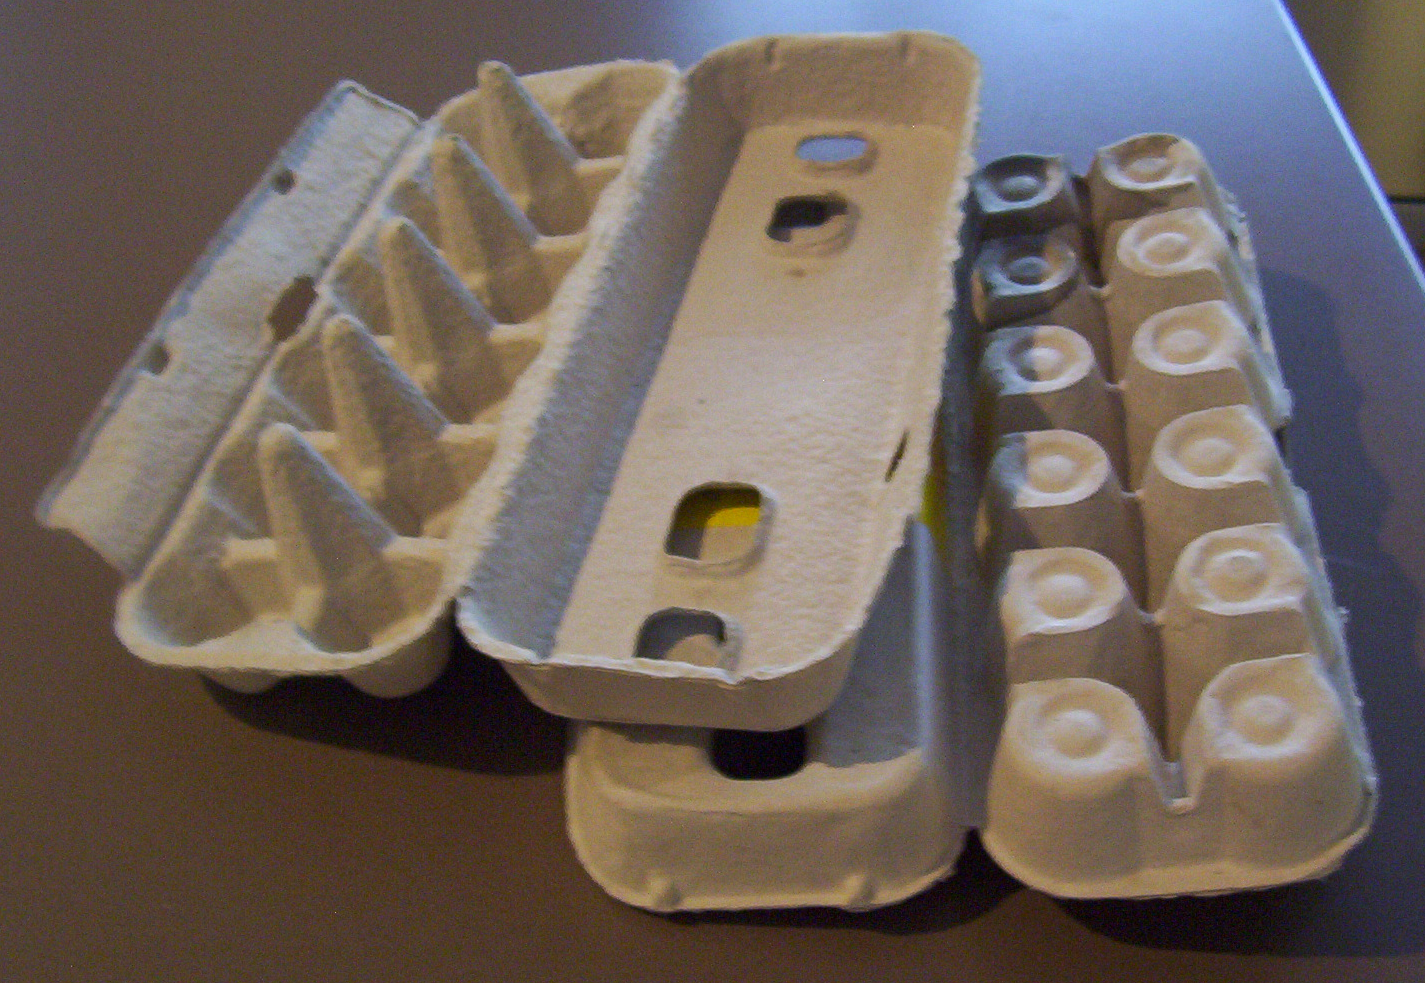
For example, if S is the semigroup of non-invertible transformations generated by the six idempotents of degree 3 and rank 2 (the details of which are not important here), then its egg-box diagram looks like the following.
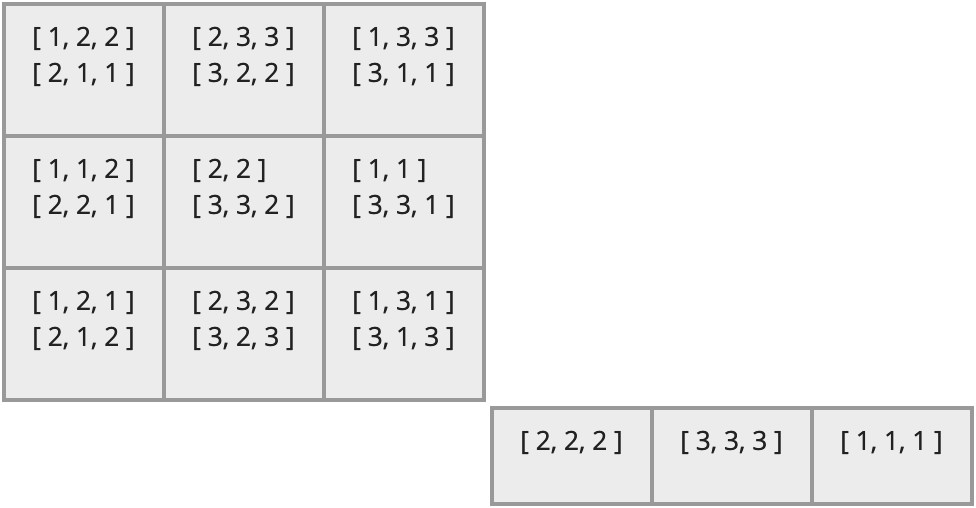
It has the following properties.
- There are two D-classes, the two large blocks.
- The first D-class has 3 R-classes (its rows), 3 L-classes (its columns) and 9 H-classes (its cells).
- Each H-class in the first D-class has two elements from the semigroup in it. (In this particular semigroup, elements can be represented as sequences of positive integers.)
- The second D-class has 1 R-class, 3 L-classes, and 3 H-classes, each with one element.
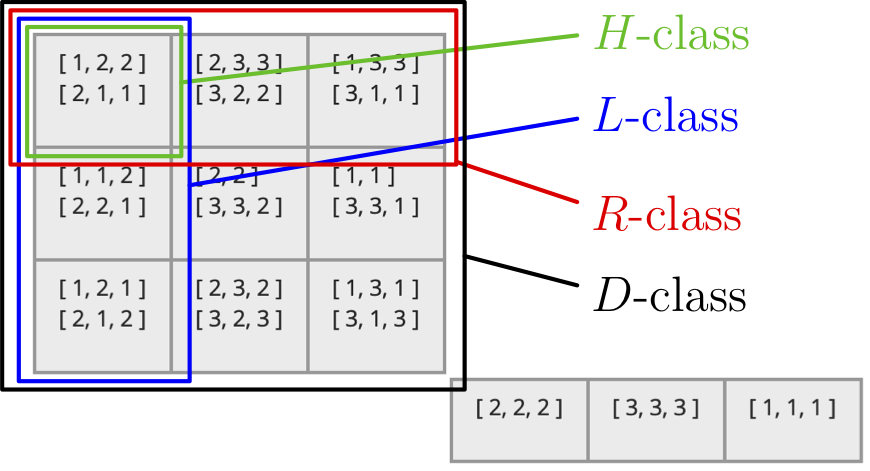
This package produces diagrams like the one shown above (without the colorful explanations). Since semigroups can be very large, it also permits you to show just a portion of the diagram, and expand/contract certain portions as needed for inspection.
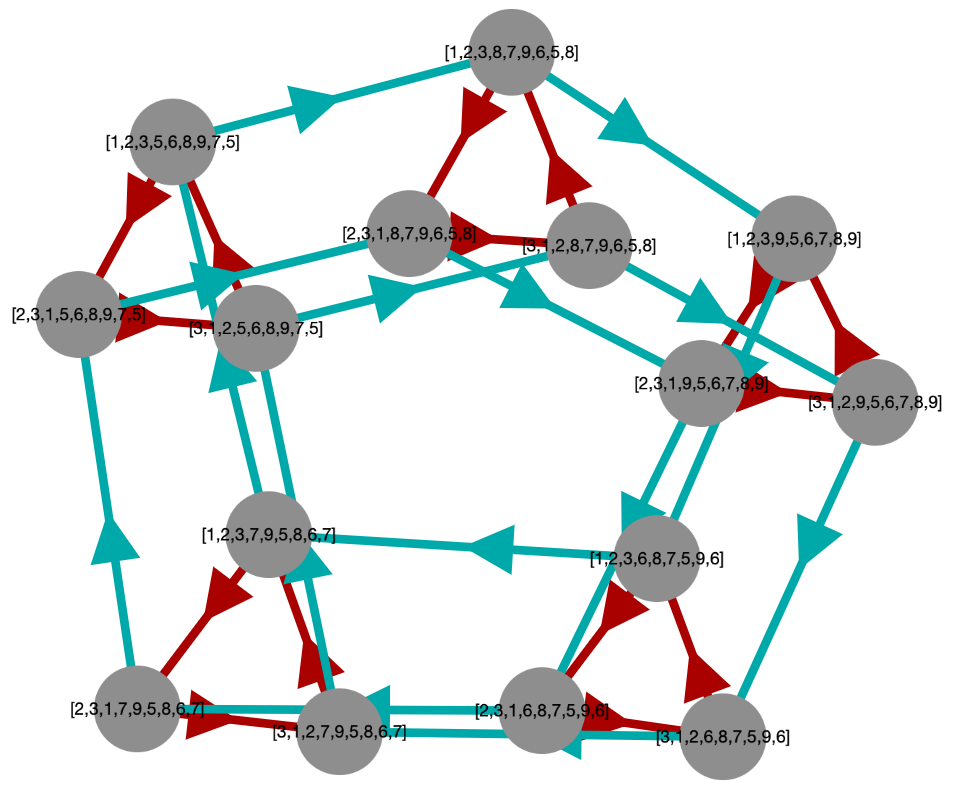
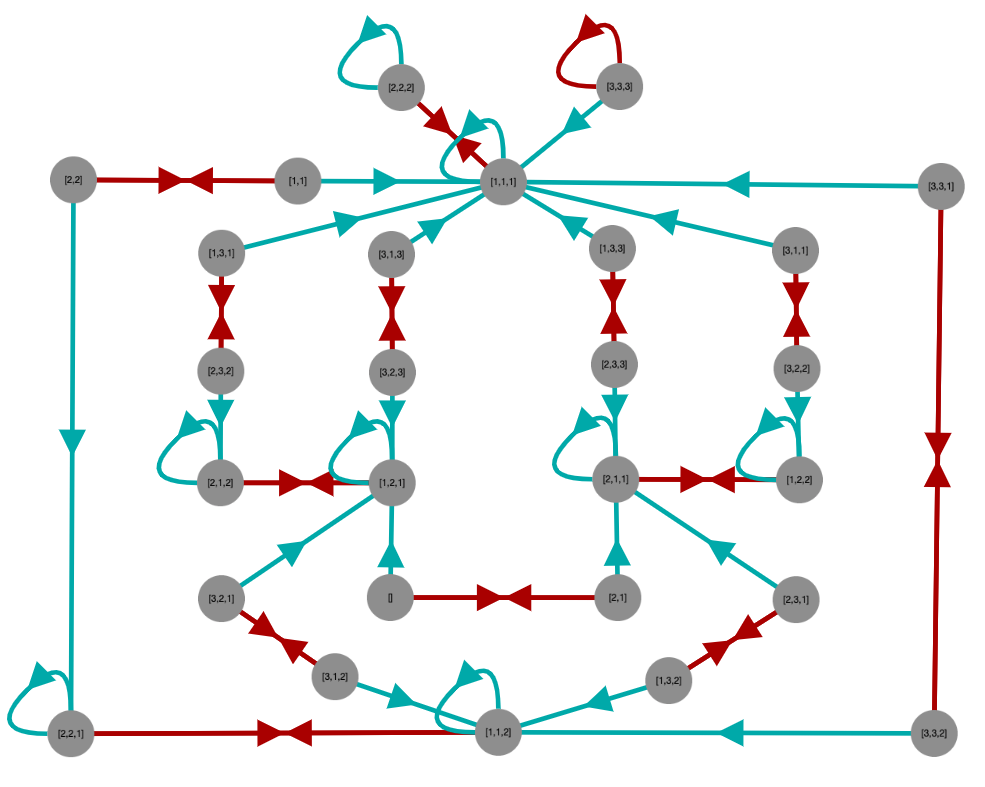
Cayley graphs
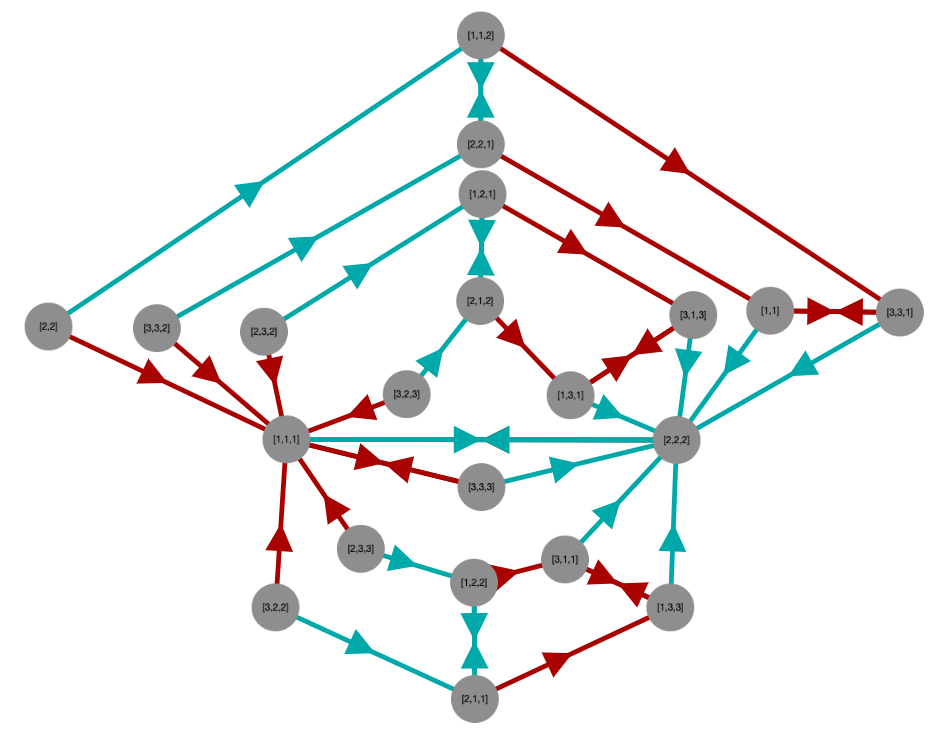
A semigroup acts on itself by right multiplication if we associate with any element s in the semigroup a function that maps any t to ts (right multiplication). If the semigroup is a group, such functions are permutations, but in general they are not.
Such functions can be graphed by defining a binary relation R from such a function so that aRb if and only if as=b. The vertices of the graph will be the elements of the semigroup and its edges will be given by R.
We can define such an R for each of the generators of a semigroup and graph each as a set of edges with a different color, to distinguish them, all on the same graph. This tends to be quite cluttered, so we might choose some subset of the generators, just enough to make the graph connected.
Here are some example results.
Usage
The package does not need to be compiled.
See the manual on the package website, which contains other usage examples and full documentation.
Maintainer
- Nathan Carter
This GAP package is free software; you can redistribute it and/or modify it under the terms of the GNU General Public License as published by the Free Software Foundation; either version 2 of the License, or (at your option) any later version.