Image in the public domain
Let S be a semigroup and let S^1 be the monoid corresponding to S, which is the same as S plus an identity element if and only if S doesn't already have one. Write S^1a for the principal left ideal generated by any element a\in S, which is the set \left\{ sa \mid s\in S^1 \right\}. Similarly, we let aS^1 mean \left\{ as \mid s\in S^1 \right\}, a principal right ideal, and S^1aS^1 mean \left\{ sas' \mid s,s'\in S^1 \right\}, a principal two-sided ideal.
We are now in a position to define Green's relations, which are what define how an "egg-box diagram" is structured. Each of the five relations defined below, L,R,J,D,H, is a binary equivalence relation on S (although the definitions use the ideals given above, which leverage S^1). We do not prove here that these are equivalence relations; consider this just the preliminaries needed to define the visualization.
Let aLb hold iff aS^1=bS^1.
Let aRb hold iff S^1a=S^1b.
Because these are equivalence relations, if we have some a\in S, we may refer to its equivalence class under L or R by [a]_L or [a]_R, respectively.
Let aJb hold iff S^1aS^1=S^1bS^1.
Let aHb hold iff aLb and aRb.
Let aDb hold iff [a]_R\cap[b]_L\neq\emptyset.
The coarsest of these five relations is D and for any given a,b\in S, if any of aLb,aRb,aJb,aHb holds then aDb holds.
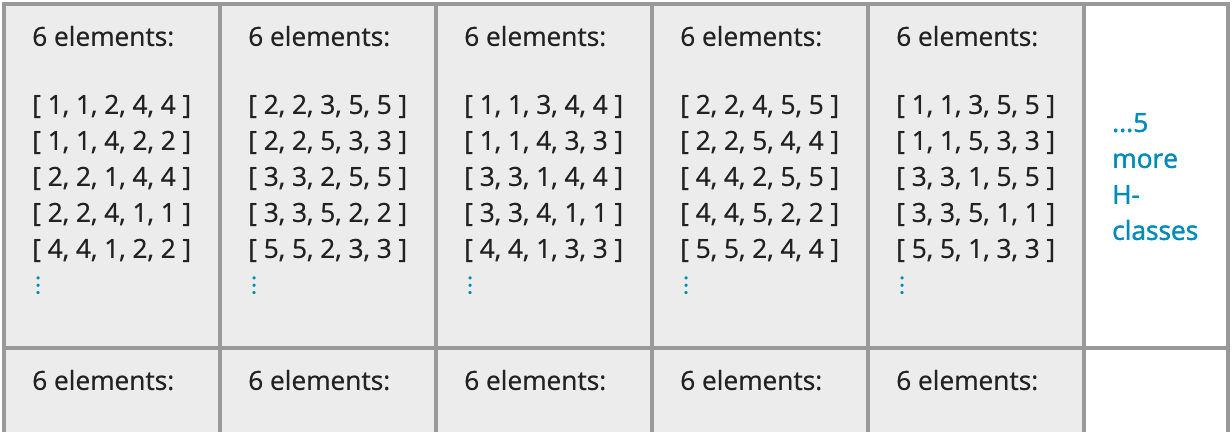
Within any given D-class, the relations L and R function on different "axes" so to speak. All [a]_L within a given D-class are the same size; the same holds for all [a]_R in each D-class. And because H is defined as the conjunction of L and R, the parts of its partition are just the intersections of [a]_L and [a]_R classes. This happens uniformly within each D-class, so all H-classes in a D-class have the same size.
This suggests dividing up the semigroup into D-classes, then dividing each D-class into H-classes, organized into a table of rows and columns with the rows corresponding to R-classes and the columns to L-classes. Each D-class is a grid of little bins (the H-classes), which gives rise to the notion of an "egg box" (or "egg carton"), since they, too, are grids of little bins.
As an example, consider the semigroup of non-invertible transformations generated by the six idempotents of degree 3 and rank 2, which you can compute with the following GAP code.
LoadPackage( "semigroups" );
S := SingularTransformationSemigroup( 3 );
Then its egg-box diagram looks like the following.
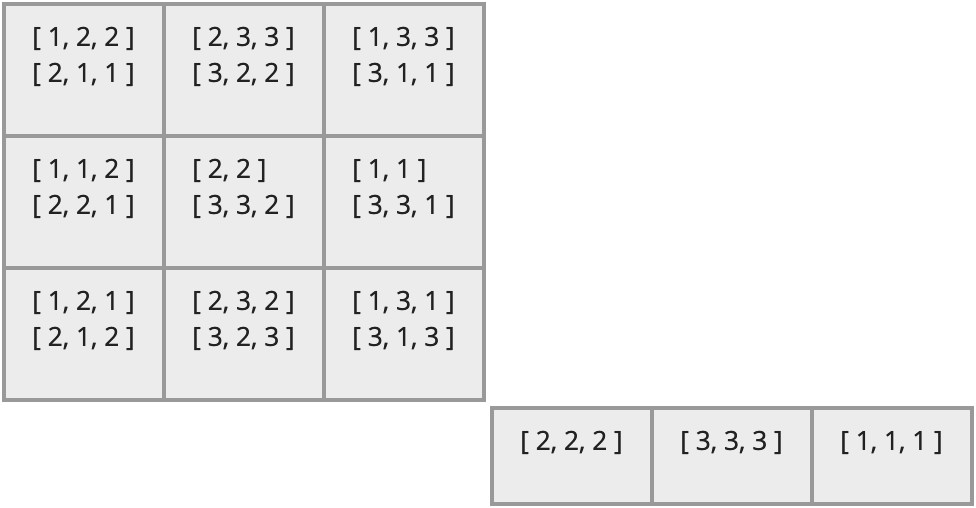
The diagram is clearly composed of two distinct components, each of which is a grid of cells, and thus each is like an "egg box."
This image was generated using this package. If you have already executed the code above to define the semigroup S, you could generate an image of the same semigroup with the following code.
LoadPackage( "semigroupviz" );
ShowEggBoxDiagram( S );
(Technically, that code will generate a much more verbose figure. See the Section 2.3 for details.)
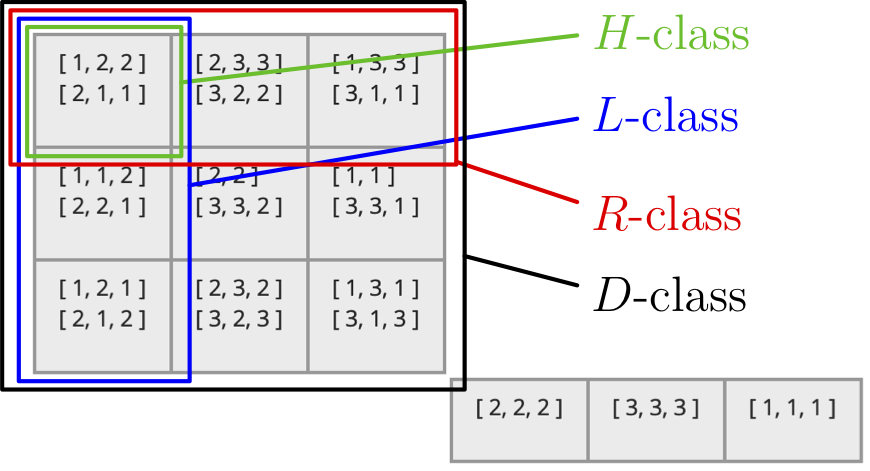
Note the following structure within that image.
Each large block is a D-class.
Each row within a D-class is an R-class.
Each column within a D-class is an L-class.
Each cell within a D-class is an H-class.
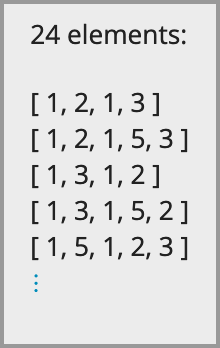
Each line within an H-class cell is an element of that H-class. In this particular case, each element is represented as a list of positive integers. For example, the first element of the first H-class is [ 1, 2, 2 ].
The figure below summarizes these facts visually.
If the elements of your semigroup have a compact representation, then the ShowEggBoxDiagram (4.1-1) function introduced in Section 2.2 will produce readable diagrams. But if the elements of the semigroup have very long names, then each H-class will be very wide, making the diagram less compact and readable.
To solve this problem, you can provide a function that maps elements of your semigroup to whatever (typically more compact) notation you'd like to use in the diagram. You pass this as one of the options to ShowEggBoxDiagram (4.1-1), under the name ToString.
For instance, the elements of the semigroup shown in Section 2.2 are Transformations, which can be shown compactly by converting them to a list and then from there to a string. The image in that section was made with the following code.
ShowEggBoxDiagram(
  SingularTransformationSemigroup( 3 ),
  rec( ToString := elt -> String( ListTransformation( elt ) ) )
);
Detailed documentation of all the options of the ShowEggBoxDiagram (4.1-1) function can be found in its documentation in Section 4.
Semigroups can be of arbitrary size, and if they become too large, then diagrams become infeasible or unhelpful to view. Thus this package provides some ways to compute only a portion of a diagram or to hide sections of a diagram as needed. This section of the manual covers these features.
In the documentation for ShowEggBoxDiagram (4.1-1), you can see that the options object permits you to provide options entitled NrDClassesIncluded, NrRClassesIncludedPerDClass, NrLClassesIncludedPerRClass, and NrElementsIncludedPerHClass. These options govern how much data should be computed by GAP and included in the HTML that shows the egg-box diagram.
The purpose of these features should be clear by considering a semigroup containing more than one billion elements. (Such semigroups are easy to create with a single function call in GAP.) Each element takes several bytes to represent, and thus the HTML generated to display such a semigroup would be many gigabytes of data. And yet humans cannot visually process every one of the billion elements, so we just want to see the overall structure of the semigroup. Thus it is not necessary for GAP to create HTML containing every detail of every H-class and all its elements. It would be sufficient to include several example D-classes, each with several example rows and columns, and each resulting H-class showing several example elements.
You can govern just how many D-, L-, and R-classes are included in the generated diagram, as well as how many elements are included in each H-class, using the options mentioned above. The diagram will make it clear, when you are viewing it, that there are additional elements not available for viewing, because GAP did not provide them to the web page to display.
Even after executing the code to generate a diagram, the viewer has control over how many of each type of class is displayed. The top right hand corner of the diagram contains a settings icon and clicking it reveals a set of controls like those shown below. (Clicking it again hides them.)

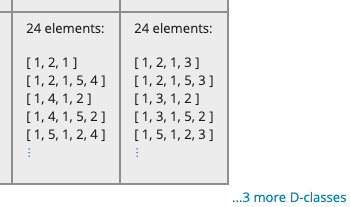
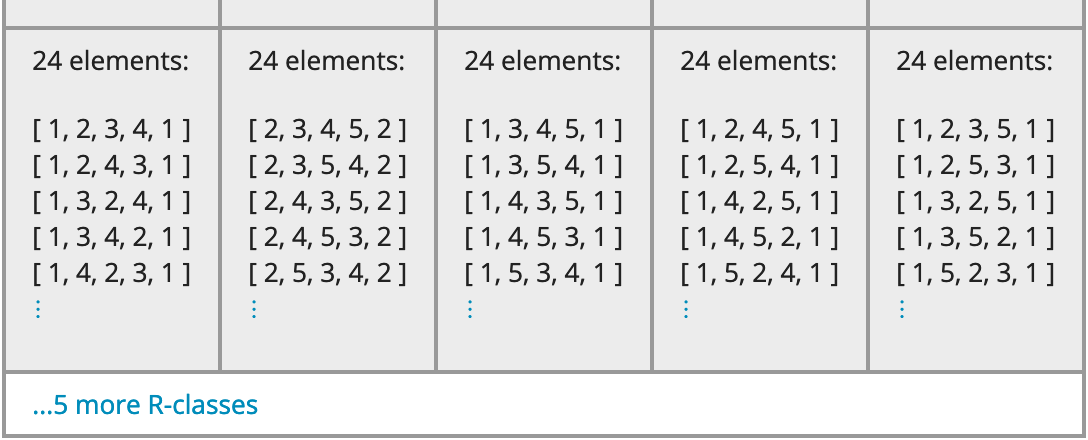
On the left, you can see a slider that controls how many D-classes are shown, as described in Section 2.4-2. Its minimum is one and maximum is the number of D-classes GAP provided when generating the diagram. In this case, that maximum is four, which is also the actual number of D-classes in the semigroup. (If it were not, the diagram would include an obvious warning about the missing data; see below.)
You can also see options for when to show the headings in an H-class, as documented in Section 2.4-2.
On the right, you can see a box that lets you customize the settings for each D-class separately. Choosing a D-class from the drop-down list at the top of that section updates all the controls below to reflect the settings you last specified for that class.
The sliders function as described in Section 2.4-2. The minimum for each is always one but the maximum is determined by the data included in the diagram by GAP. This may be the actual number of L- or R-classes in the semigroup, or the actual number of elements in an H-class, or it may be less than that number if GAP provided only a subset of the semigroup when generating the diagram's data.
In that latter case, the interface makes it obvious, as you can see with the bright blue box at the bottom right of the above image. It warns the user that the H-class slider has a maximum of 20 because the GAP code that generated this diagram included only 20 elements per H-class, even though there are actually 24 elements per H-class in this particular D-class in the semigroup itself.
No such bright blue boxes appear under the sliders for the R- or L-classes, meaning that in this particular D-class, every R- and L-class in the semigroup has been provided by GAP to the diagram for viewing.
If you want to make such warnings go away, so that all (or at least more) elements are included in the diagram, you must regenerate the diagram with another call to ShowEggBoxDiagram (4.1-1), this time providing larger values for the relevant option(s), NrDClassesIncluded, NrRClassesIncludedPerDClass, NrLClassesIncludedPerRClass, and/or NrElementsIncludedPerHClass.
While viewing an egg-box diagram, the following interactive options are available to you.
If you show the settings controls documented in Section 2.4-1, then you can interact with those controls as follows.
The slider entitled "Show this many D-classes:" can be dragged to show or hide D-classes. The diagram updates as you drag the slider. If you move this slider below its maximum, then a note is included at the bottom right of the diagram, indicating that there are other D-classes not shown.
Regardless of whether the settings controls are shown or hidden, you can click such a message to expose all available hidden D-classes. To reverse such an action, use the slider.
The radio buttons allow you to choose when to include a heading in H-classes:
Always: Every H-class in the diagram will begin with a heading stating its size, such as "15 elements:".
Never: No H-class in the diagram will begin with a heading; only the elements are shown.
When needed: Each H-class in the diagram is treated separately. A heading stating the number of elements is omitted if and only if all elements are shown. That is, the diagram reports the number of elements only if it cannot be deduced visually from the cell.
The drop-down list entitled "Choose a D-class by representative:" is present because the right-hand section of the diagram settings are not global, but local within each D-class. First choose the D-class whose settings you will edit, then proceed to adjust those settings with the controls beneath the drop-down list. Choosing a new D-class updates the controls to reflect the settings you've already set for that class.
The slider for the number of R-classes to show determines the number of rows that will be shown in the chosen D-class. If you do not choose to show all R-classes in the D-class, then the D-class will end with an ellipsis and a message indicating that there are some R-classes not shown.
Regardless of whether the settings controls are shown or hidden, you can click such a message to expose all available hidden R-classes within a D-class. To reverse such an action, use the slider.
The slider for the number of L-classes to show determines the number of columns that will be shown in the chosen D-class. If you do not choose to show all L-classes in the D-class, then each row will end with an ellipsis and a message indicating that there are some L-classes not shown.
Regardless of whether the settings controls are shown or hidden, you can click such a message to expose all available hidden L-classes within a D-class. To reverse such an action, use the slider.
The slider for the number of elements to show determines the number of lines that will be shown in each cell (H-class) of the chosen D-class. If you do not choose to show all elements in each H-class, then each cell will end with an ellipsis indicating that there are some elements not shown.
Regardless of whether the settings controls are shown or hidden, you can click such a message to expose all available hidden elements within an H-class. To reverse such an action, use the slider.
There are other ways to interact with the diagram using your mouse, independent of the settings controls. These features function whether the settings controls are open or closed.
Hovering your mouse over any cell in the diagram will list all the elements included in that H-class, even if not all are currently being shown in the cell. This way you can keep the diagram of a manageable size for high-level viewing, but drill down by hovering on any given cell.
Clicking on the elements shown in any cell in the diagram will expand just that cell to include all known elements in that H-class. Clicking again will collapse it to show just the number you've chosen in the settings, as indicated above.
generated by GAPDoc2HTML