A semigroup S can be said to act on itself by right multiplication if we associate with any element s\in S a function f_s:S\to S that performs right multiplication by the element s, that is, f(t)=ts. Similarly, a semigroup can act on itself by left multiplication if with any given s\in S we associate a function f_s(t)=st.
For now, we will discuss actions only by right multiplication.
If S is a group, each of these functions (or "actions") is a permutation, and is thus often written \phi_s rather than f_s.
We can illustrate any f_s by considering the elements of S as the vertices in a graph and letting there be an edge between two elements t,t'\in S if and only if f_s(t)=t'. Such a graph draws an arrow from each t to its image t' under f_s.
If we have a set of elements \left\{ s_1,\ldots,s_n \right\}, we can illustrate all the actions f_{s_1},\ldots,f_{s_n} on one graph by keeping the same vertex set (all elements of S) and letting there be a different set of edges for each f_{s_i}. Typically we distinguish the edge sets by assigning each a different color, and then it is possible to draw them all on the same graph and still distinguish them.
If we choose \left\{ s_1,\ldots,s_n \right\} to be a generating set for the semigroup, then the resulting graph will be connected. (In fact, in many cases, a proper subset of the generators will ensure that the graph is connected.)
As an example, consider the semigroup of non-invertible transformations generated by the six idempotents of degree 3 and rank 2, which you can compute with the following GAP code.
LoadPackage( "semigroups" );
S := SingularTransformationSemigroup( 3 );
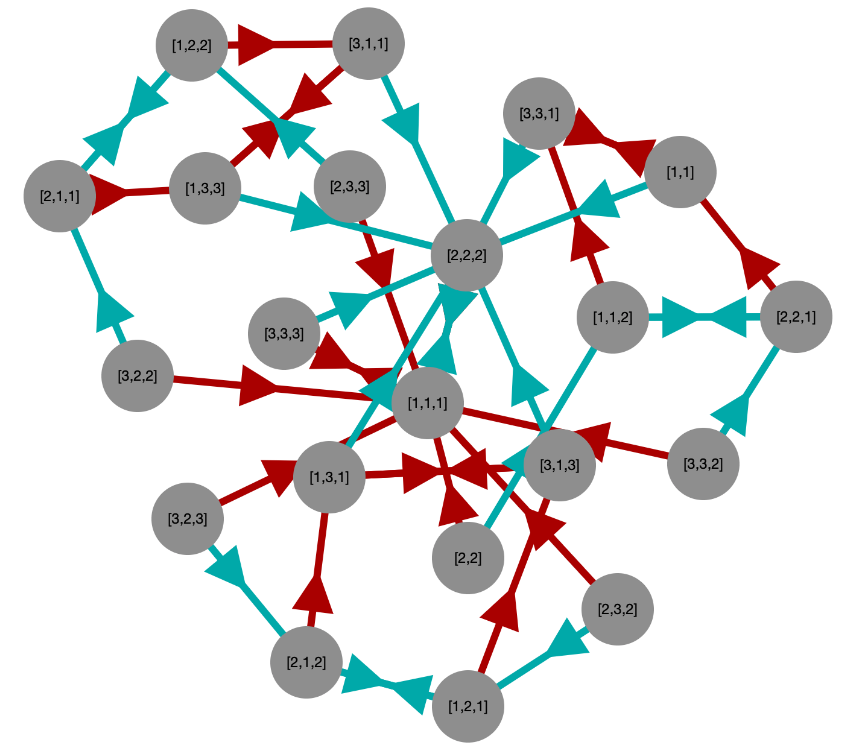
A Cayley graph of this semigroup can be connected with just two generators. Generating that diagram using one of the tools from this package yields the following result.
In section 3.4 we will cover how to organize such diagrams better.
You can optionally include labels for each edge in the diagram as well, although this can often make it quite cluttered, so it is disabled by default. (See the options for ShowCayleyGraph (4.1-2) for details.) But it is also possible to infer the elements from the graph in two different ways.
For many semigroups, it will be obvious which element is represented by each color, because there is only one element in the semigroup that could act on the semigroup's elements in the way shown by the arrows in question. (This is always true in groups, but is not true for some elements of some semigroups.)
If you provided a generators list when generating the semigroup, those generators were assigned colors evenly spaced along the color spectrum, in increasing frequencies (red first, violet last). So the red generator is always first, the second will usually be green or greenish blue, and so on.
When in doubt, simply regenerate the diagram with the option enabled to show the names of the elements on each edge.
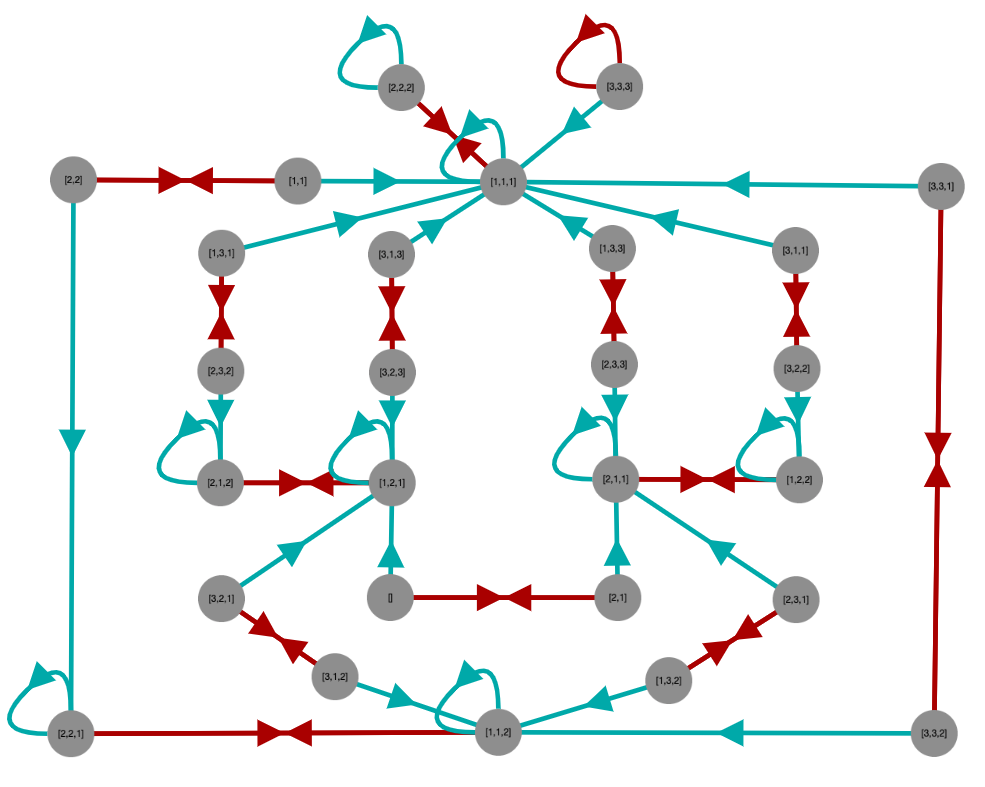
If the semigroup is sufficiently large, attempting to create a Cayley graph will tend to lead to an image so busy with vertices and edges that the viewer cannot take any useful information from it. The typical limit is somewhere around 100 elements. For instance, the following Cayley graph of a semigroup with 256 elements is almost completely useless due to the number of visual elements present.
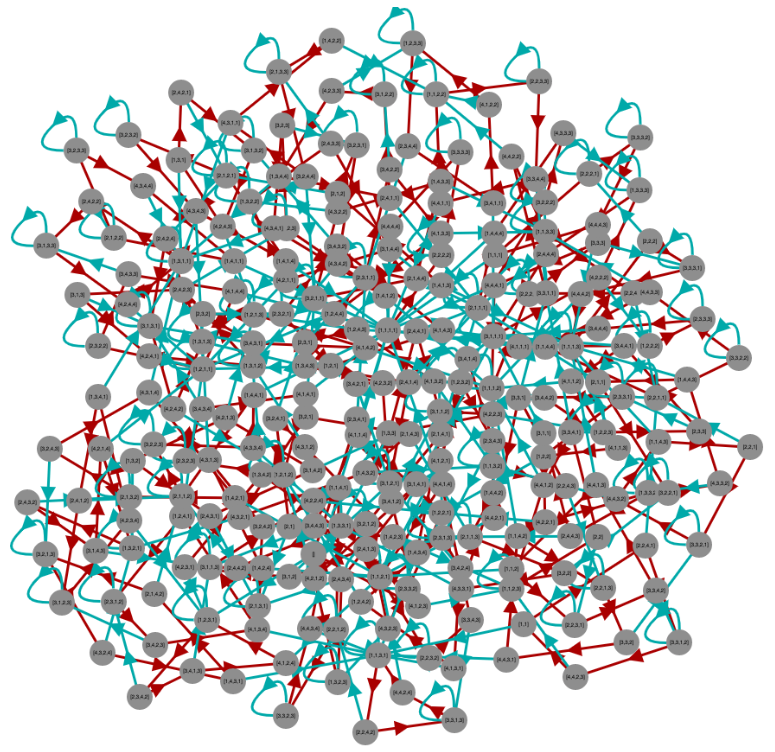
If the elements of your semigroup have a compact representation, then the ShowCayleyGraph (4.1-2) function introduced in Section 3.2 will produce readable graphs. But if the elements of the semigroup have very long names, then the text at each vertex of the graph will clutter the graph and make its structure less apparent (and the overall result less attractive).
To solve this problem, you can provide a function that maps elements of your semigroup to whatever (typically more compact) notation you'd like to use in the diagram. You pass this as one of the options to ShowCayleyGraph (4.1-2), under the name ToString.
An example appears in Section 2.3, where the same option is documented for ShowEggBoxDiagram (4.1-1).
Detailed documentation of all the options of the ShowCayleyGraph (4.1-2) function can be found in its documentation in Section 4.
The SemigroupViz package uses the Cytoscape graph-drawing library to render Cayley graphs. You can interact with them in any of the ways provided by that library, including:
Click and drag a vertex to reposition it.
Click a vertex to select it, then Shift-Click or Control-Click (Command-Click on Mac) other vertices to add to the selection. Drag the entire selection to reposition it. Click on the background to deselect.
Use the mouse wheel to zoom in or out.
Click and drag on the background to reposition the entire graph.
Shift-Click or Control-Click (Command-Click on Mac) on the background and drag to create a selection rectangle to select a group of vertices. Reposition/unselect as described above.
This package does not contain any mechanism for creating aesthetically pleasing Cayley graph layouts. Cytoscape automatically lays out the graph in a way that is somewhat balanced, but there is typically much more symmetry inherent in a semigroup than cytoscape's default layout makes evident. Consider the following examples.
LoadPackage( "semigroupviz" );
S := SingularTransformationSemigroup( 3 );
compact := x ->
    ReplacedString( String( ListTransformation( x ) ), " ", "" );
ShowCayleyGraph( S, rec( ToString := compact ) );
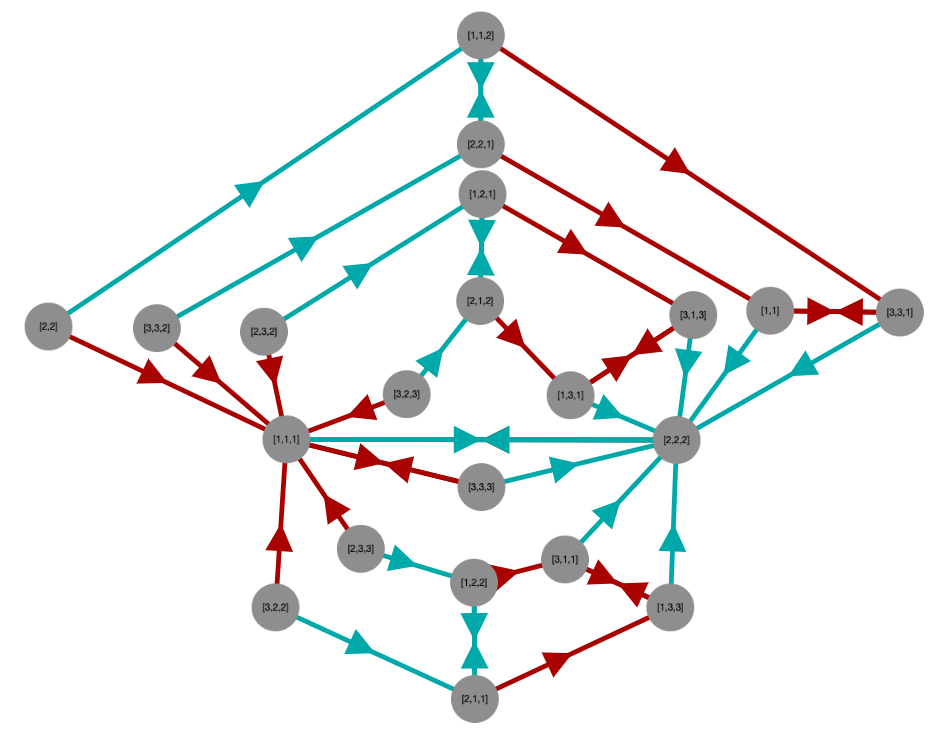
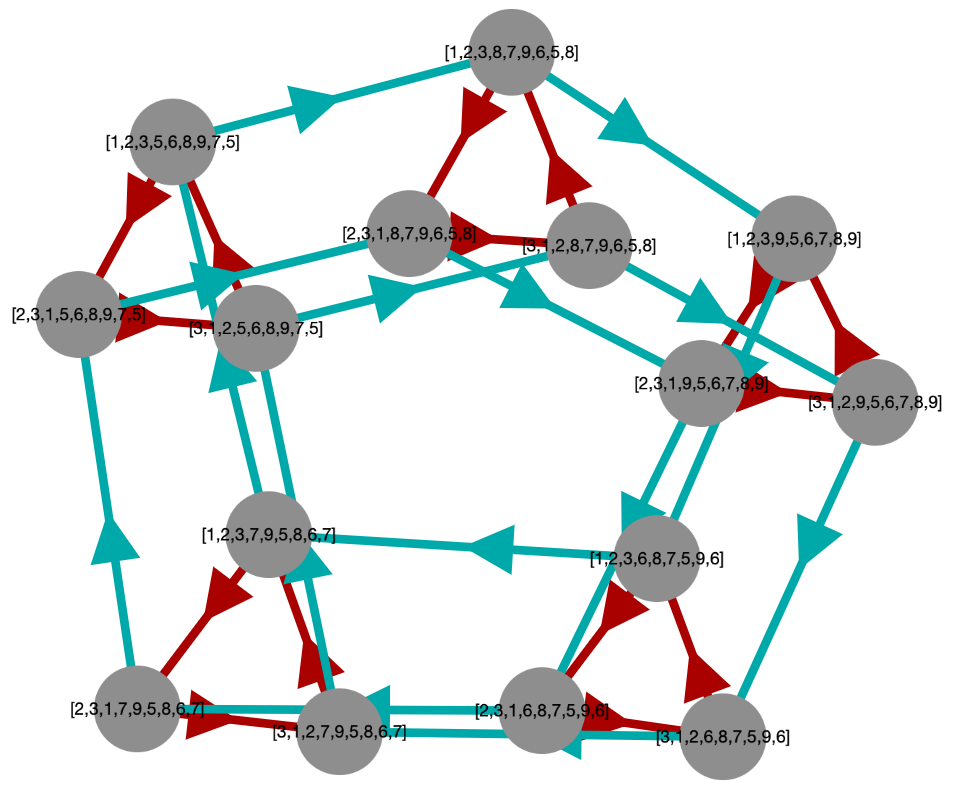
This produces the rather disorganized figure shown in Section 3.2. But if we put in some manual effort to drag the nodes around, we can often find a more aesthetically pleasing arrangement of them.
P := DirectProduct(
    Semigroup( [ Transformation( [ 2, 3, 1 ] ) ] ), # group Z_3
    Semigroup( [ Transformation( [ 3, 5, 4, 2, 6, 3 ] ) ] ) # group Z_5
); # group Z_3 x Z_5
ShowCayleyGraph( P, rec( ToString := compact ) );
This produces the following somewhat organized initial image due to the inherent symmetry in the Cayley graphs of groups.
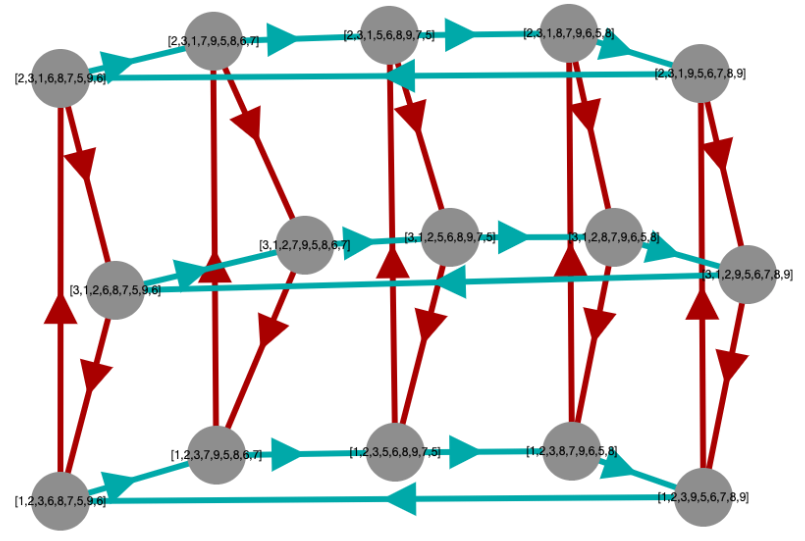
But even so, we can still make it more attractive (sometimes in more than one way) by rearranging the vertices, as shown in the following images.
P := DirectProduct(
    Semigroup( [ Transformation( [ 2, 3, 1 ] ) ] ), # group Z_3
    Semigroup( [ Transformation( [ 3, 5, 4, 2, 6, 3 ] ) ] ) # group Z_5
); # group Z_3 x Z_5
ShowCayleyGraph( P, rec( ToString := compact ) );
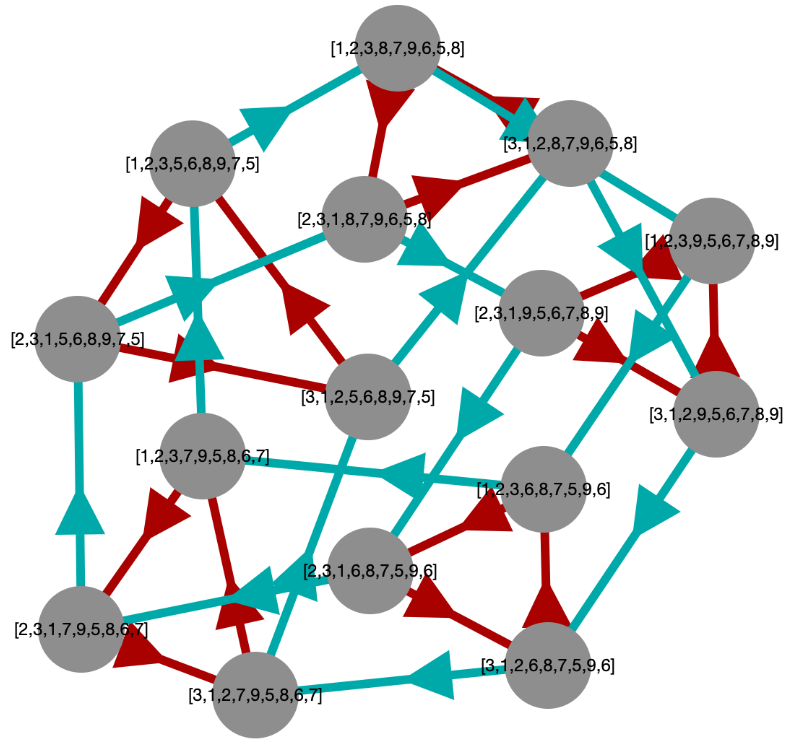
This produces the disorganized initial image shown below.

But we can make it more attractive by rearranging the vertices, as shown in the following image.
generated by GAPDoc2HTML