1. Introduction to Data Science
See also the slides that summarize a portion of this content.
1.1. What is data science?
The term “data science” was coined in 2001, attempting to describe a new field. Some argue that it’s nothing more than the natural evolution of statistics, and shouldn’t be called a new field at all. But others argue that it’s more interdisciplinary. For example, in The Data Science Design Manual (2017), Steven Skiena says the following.
I think of data science as lying at the intersection of computer science, statistics, and substantive application domains. From computer science comes machine learning and high-performance computing technologies for dealing with scale. From statistics comes a long tradition of exploratory data analysis, significance testing, and visualization. From application domains in business and the sciences comes challenges worthy of battle, and evaluation standards to assess when they have been adequately conquered.
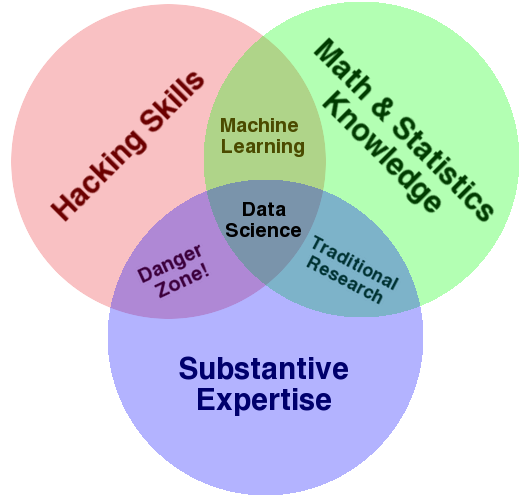
This echoes a famous blog post by Drew Conway in 2013, called The Data Science Venn Diagram, in which he drew the following diagram to indicate the various fields that come together to form what we call “data science.”
Regardless of whether data science is just a part of statistics, and regardless of the domain to which we’re applying data science, the goal is the same: to turn data into actionable value. The professional society INFORMS defines the related field of analytics as “the scientific process of transforming data into insight for making better decisions.”
1.2. What do data scientists do?
Turning data into actionable value usually involves answering questions using data. Here’s a typical workflow for how that plays out in practice.
Obtain data that you hope will help answer the question.
Explore the data to understand it.
Clean and prepare the data for analysis.
Perform analysis, model building, testing, etc.
(The analysis is the step most people think of as data science, but it’s just one step! Notice how much more there is that surrounds it.)
Draw conclusions from your work.
Report those conclusions to the relevant stakeholders.
Our course focuses on all the steps except for the analysis. You’ve learned some introductory statistical analysis in one of the course prerequisites (GB213), and we will leverage that. (Later in our course we will review simple linear regression and hypothesis testing.) If you have taken other relevant courses in statistics, mathematical modeling, econometrics, etc., and want to bring that knowledge in to use in this course, great, but it’s not a requirement. Other advanced statistics and modeling courses you take later will essentially plug into step 4 in this data science workflow.
1.3. What’s in our course?
Our course covers the following four foundational aspects of data science.
Mathematics: We will cover foundational mathematical concepts, such as functions, relations, assumptions, conclusions, and abstraction, so that we can use these concepts to define and understand many aspects of data manipulation. We will also make use of statistics from GB213 (and optionally other statistics courses you may have taken) in course projects, and we will briefly review that statistical material as well. We will also see small previews of other mathematics and statistics courses and their connections to data science, including graphs for social network analysis, matrices for finding themes in relations, and supervised machine learning.
Technology: We will extend your Python knowledge from the CS230 prerequisite with more advanced table manipulation functions, extended practice with data cleaning and manipulation tasks, computational notebooks (such as Jupyter), and GitHub for version control and project publishing.
Visualization: We will learn new types of plots for a wide variety of data types and what you intend to communicate about them. We will also study the general principles that govern when and how to use visualizations and will learn how to build and publish interactive online visualizations (dashboards).
Communication: We will study how to write comments in code, documentation for code, motivations in computational notebooks, interpretation of results in computational notebooks, and technical reports about the results of analyses. We will prioritize clarity, brevity, and knowing the target audience. Many of these same principles will arise when creating presentations or videos as well. Each of these modes of communication is required at some point in our course.
Details about specific topics and their order appears in the Detailed Course Schedule appendix.
1.4. Will this course make me a data scientist?
This course is an introduction to data science. Learning more math, stats, and technology will make you more qualified than just this one course can. (Bentley University has both a Data Analytics major and a Data Technologies minor, if you’re curious which courses are relevant.)
But there are two focuses of our course that will make a big difference:
1.4.1. Learning on your own (LOYO)
Big Picture - The importance of Learning on Your Own
I once heard a director of informatics in the health care industry describe how quickly the field of data science changes by saying, “There aren’t any experts; it’s just who’s the fastest learner.” For that reason, it’s essential to cultivate the skill of being able to learn new tools and concepts on your own.
Thus our course requires you to do so. Once during the course you must research a topic outside of class and report on it to the class, through writing, presenting, video, or whatever modality makes sense for the content. To help you choose a topic, I’ve marked many possible topics throughout these course notes, in red boxes entitled “Learning on Your Own.” The first such boxes appear below, in this chapter, but you’ll find many more sprinkled throughout future chapters as well.
If you’re interested in a career in data science, I encourage you to follow data scientists on platforms like Twitter and Medium so that you’re kept abreast of the newest innovations and can learn those that are relevant to your area of specialty.
1.4.2. Excellent communication
This was already mentioned earlier, but I will re-emphasize it here, because of its importance. In a meeting between the Bentley University Career Services office and about a dozen employers of our graduates, the employers were asked whether they preferred technical knowledge or what some call “soft skills” and others call “power skills,” which include communication perhaps first and foremost. Unanimously every employer chose the latter.
Big Picture - The importance of communication
Data science is about turning data into actionable knowledge. If a data scientist cannot take the results of their analysis and effectively communicate them to decision makers, they have not turned data into actionable knowledge, and have therefore failed at their goal. Even if the insights are brilliant, if they are never shared with those who need them, they achieve nothing. Good communication is essential for data work.
Consequently our course will contain several opportunities for you to exercise your communication skills and receive feedback from the instructor on doing so. See the comments under the “communication” bullet above, and the course outline in the appendix. The first such opportunities appear immediately below.
1.5. Where should I start?
There are several topics you can investigate on your own that will help you get a leg up in our course. None of these topics is required for our course, but each is available for you to investigate outside of class and report back, to fulfill the “Learning on Your Own” requirement mentioned above.
Learning on Your Own - File Explorers and Shell Commands
On Windows, the file explorer is called Windows Explorer; on Mac, it is called Finder. It is essential that every computer-literate person knows how to use these tools. Most of the actions you can take with your mouse in Windows Explorer or OS X Finder can also be taken using commands at a command prompt. On Windows, this prompt can be found by running command.exe; on Mac, it can be found in Terminal.app. It is very useful to know how to do at least basic file manipulation tools with the command prompt, because it enables you to perform the same actions in cloud computing evironments where a file explorer may not be available.
A report on file explorers and shell commands would address all of the following points.
What the folder tree/hierarchy is
What a file path is and how they are written differently on Windows and OS X
How to accomplish each of the following tasks from both the file explorer and the command prompt
Navigate to your home folder
Move one step up/down the folder hierarchy
Copy a file
Move a file
From the command prompt:
How to list all files in the current folder
How to view the contents of a text file
From the file explorer:
What happens when you double-click a file in a file explorer
What file extensions are used for
What are some of the dangers of changing a file extension
Learning on Your Own - Numerical Analysis
One valuable contribution that computers make to mathematics is the ability to get excellent approximations to mathematical questions without needing to do extensive by-hand calculations. For instance, recall the trapezoidal rule for estimating the result of an integral (covered in the courses MA126 and MA139). It says that we can estimate the value of \(\int_a^b f(x)\;dx\) by computing the area of a sequence of trapezoids. Choose some points \(x_0,x_1,\ldots,x_n\) evenly spaced between \(a\) and \(b\), with \(x_0=a\) and \(x_n=b\), each one a distance of \(\Delta x\) from the previous. Then the integral is approximately equal to \(\frac{\Delta x}{2}\left(f(x_0)+2f(x_1)+2f(x_2)+\cdots+2f(x_{n-1})+f(x_n)\right)\).
A computational notebook reporting on this numerical technique would cover:
how to implement the trapezoidal rule in Python, given as input some function
f, some real numbersaandb, and some positive integernat least one example of how to apply it to a simple mathematical function
fwhere we know the precise answer from calculus, comparing the result for various values ofnat least one example of how to apply it to a set of data, when a smooth function
fis not available